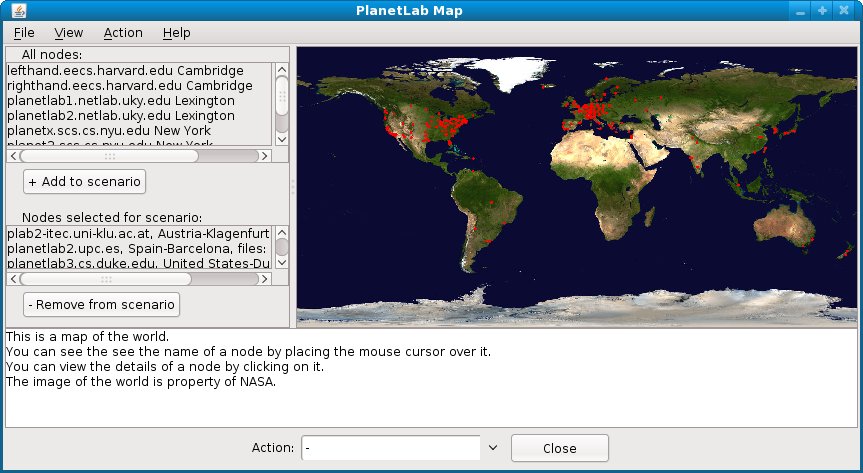
There are two ways to start the program:
-
- Using ant:
Just type ant run in the root folder. -
- Otherwise:
Execute ./PlanetLabVisualizer.sh (or PlanetLabVisualizer.bat on Windows) to start the program.
Make sure that the folder which contains java is in your PATH variable (Windows: look here, Linux: look here).
There are some things you'll need to do before you can start with the tutorial:
Start the ssh-agent (or pageant) and add your ssh-key to the ssh-agent by using ssh-add /path/to/your/key. and add your ssh-key to it.
Make sure that the PuTTY program folder (e.g. C:\Program Files\PuTTY) is in your PATH variable.
This is needed to execute the pscp.exe when transferring files to nodes.
If you're reading this text through the help window, just go to Menu -> File -> Preferences.
Now we can start with the tutorial:
Chosing Node Details opens a Window showing more information about a node.
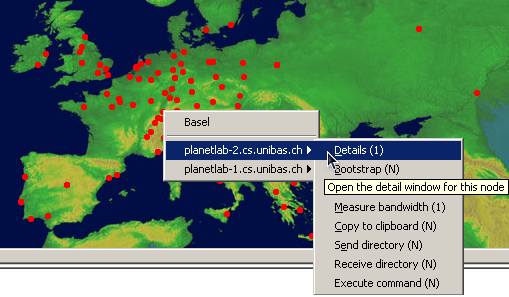
This will open the Node Details window.
Here you can see some node details like it's Hostname, Location, the configured bandwidth-limit of the node
and the Boot-State ("boot" means normal state, other states are: debug (dbg), to be re-installed (rins) and to be first-time installed (ins))
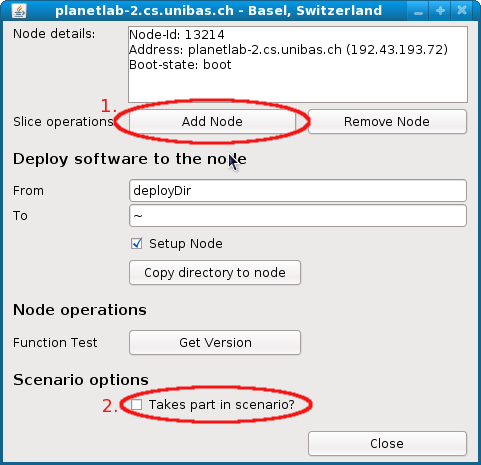
Add the node to your slice by klicking on the "Add to slice" button.
Note that it may take a while until your slice on the new Node is accessible because the ressources need to be allocated first.
Add the node to your scenario configuration by checking "Takes part in scenario"
You may have noticed that the list with the scenario nodes now contains the node:
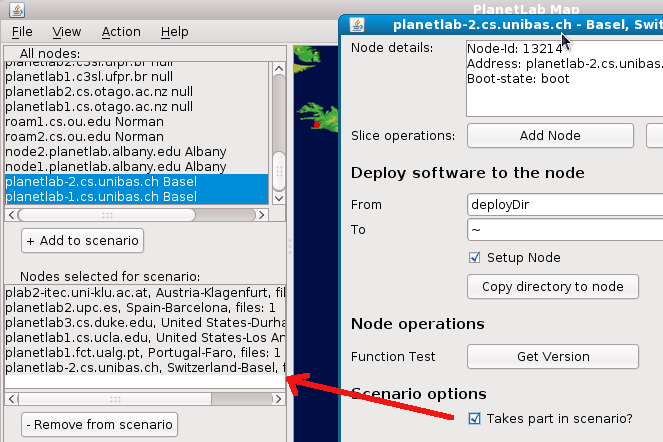
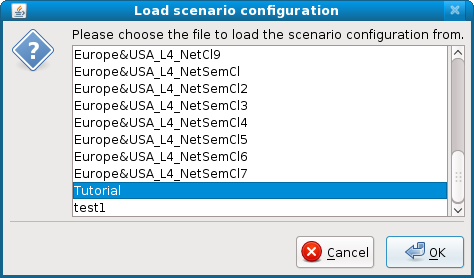
The world map now shows only the nodes which are selected in the scenario.
(You can change this by selecting View -> "Show all nodes" or "Show selected nodes" from the menu)

(The (N) means that the operation may be executed for many nodes at once. You can test this by selecting 2 or more nodes in the list and then chosing "Send directory (N)".)
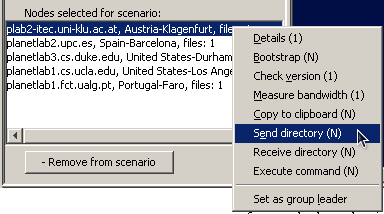
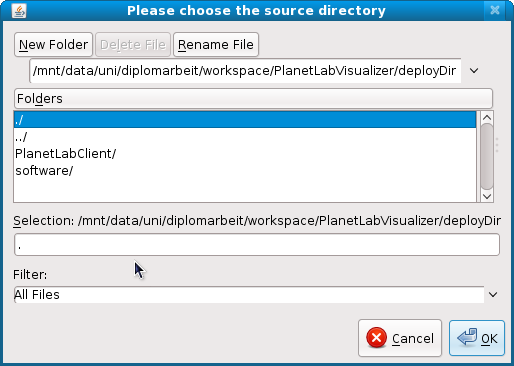
and "~" as the destination directory on the node.

The deployDir from the PlanetLabVisualizer folder is now transferred to your home directory at the node.
(On linux the transfer is done using rsync so the next time you need to update your node only the changed files will be copied.
On Windows systems the whole directory will be transferred using PuTTy as there is no rsync alternative as far as I now.)

There are two alternative ways to transfer files from your PC to the nodes:
Chose Action -> "Copy dir to selected nodes" to perform this operation.
The transferred software on the nodes needs to be started to be able to receive commands from the Visualizer e.g. to start/stop an experiment.
To bootstrap all scenario nodes chose Action -> "Bootstrap selected nodes" from the menu.
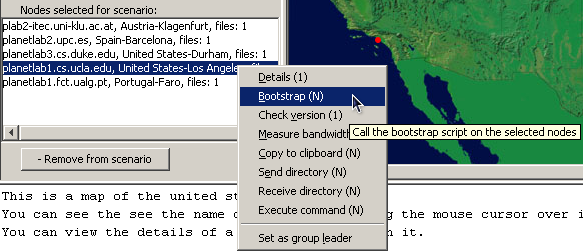
There will be a lot of output to stdout while the software is started on the nodes.
If the bootstrapping process was successful the client software is listening on a remote port for incoming CORBA-RMI connections
Also a slice-owned ssh-server will be listening on a remote port (only needed for bandwidth-measurements as they are done using scp).
or again by chosing Action -> "Get selected nodes versions" from the application menu.
This is a simple check where a remote method from each node is called. Failed nodes will be marked red in the Node list.

The details of the operation are again printed to stdout.
The output may be useful if you want to trace back the reason of the failure (e.g. Connection refused or Connection timed out problems).
As mentioned above, up to now the only implemented experiment is the X2X simulator,
which forms groups of the scenario nodes
and then measures the bandwidths between the nodes of each group.
You can open the X2X sim window by chosing File -> Show simulator window.
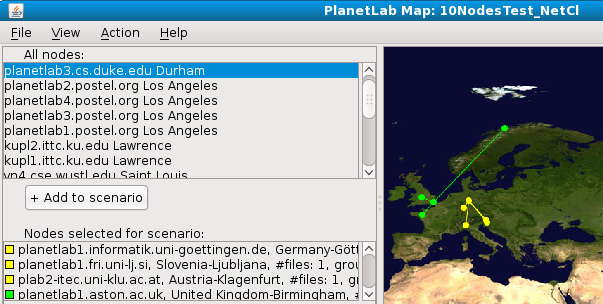
Here are some screenshots showing the X2X sim in action:
The edges shown on the map are drawn from each node to the leader of the group.
In this scenario the 2 leaders are in Kent (UK) and Göttingen (GER).
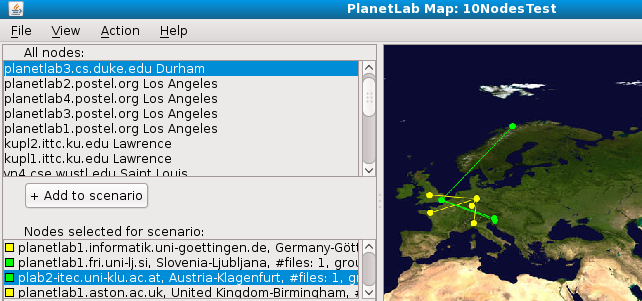
This means that we're running a Network Closeness experiment by measuring the bandwidths from each node to the leaders to form the Network Closeness based groups.
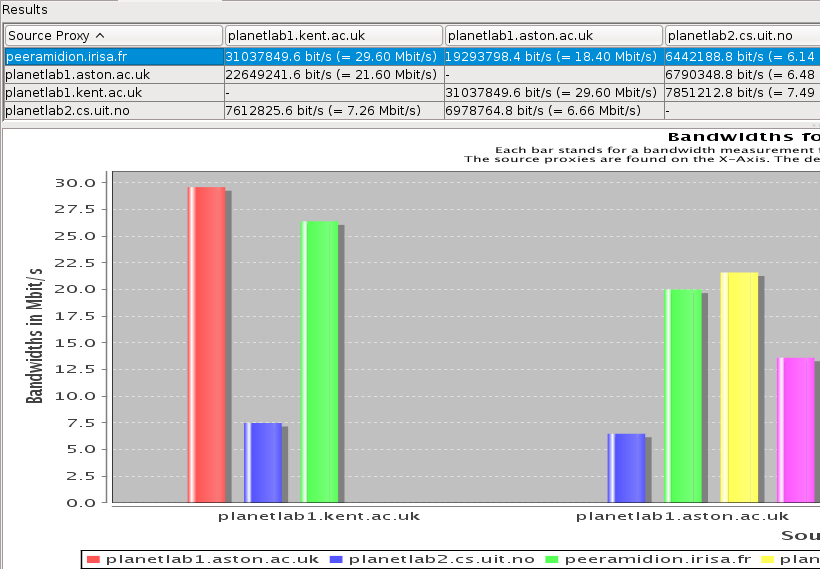
Afterwards the average group bandwidth is also calculated again by measuring bandwidths but this time from each node to every other member of the group.
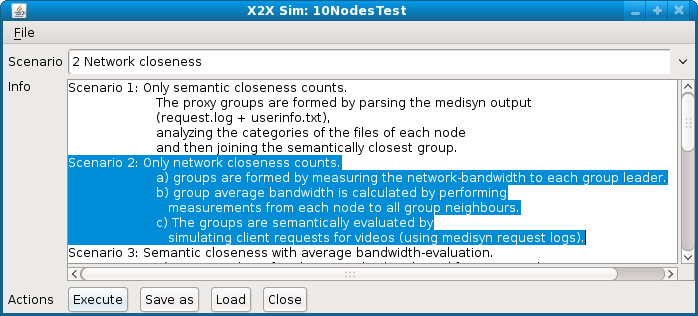
Here you can see the X2X Sim window, where we've selected to execute the Network Closeness scenario (Scenario 2).
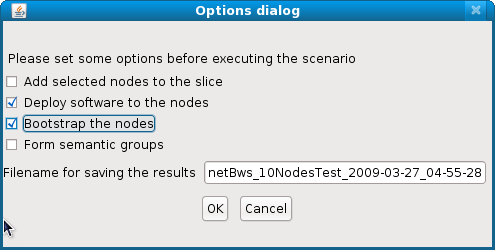
Here we can select some options and actions to perform before the bandwidth measurements start.
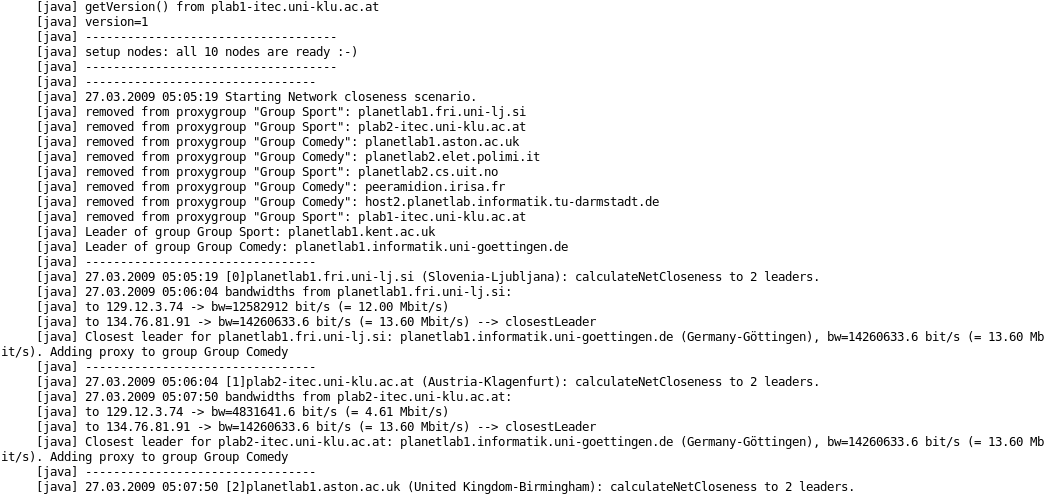
During the execution of the experiment you can watch the current state by taking a look at the stdout.
Note that many of the nodes have switched to the other group.
For more information about X2X take a look here: http://www-itec.uni-klu.ac.at/~laszlo/x2x.pdf
Well, hopefully my master thesis will be finished soon, so more information should be obtained there ... but time will tell.
History
Ryan Peterson (ryanp at cs.cornell.edu) and
Lev Reyzin (lev.reyzin at yale.edu) in Princeton
and was available under: http://www.cs.princeton.edu/nsg/planetlab/visualizer/
I started it in March 2007 as a part of my master thesis.
I removed the dependencies of v1.0 to Sophia, a PlanetLab service, which seems to be offline.
Furthermore I developed the PlanetLabClient which is ment to run on the PlanetLab nodes, and added many features to the PlanetLabVisualizer.
License
They are all located in the lib directory.
Owner: Maxmind
Source: http://www.maxmind.com/app/java
License: LGPL
Comment: "This product includes GeoLite data created by MaxMind, available from http://maxmind.com"
Makes it possible to draw a node on the world map.
It's used together with the GeoLite City database (GeoLiteCity.dat) which stands under the OPEN DATA LICENSE.
http://geolite.maxmind.com/download/geoip/database/LICENSE.txt
Owner: Apache Software Foundation
Source: http://ws.apache.org/xmlrpc
License: Apache License
Use: The communication to the PlanetLab-API works using XML-RPC and these libraries are used for it.
Owner: jfree.org
Source: http://www.jfree.org/jfreechart
License: LGPL
Use: They are used to create Bar charts from the bandwidth results.
Source: http://www.jacorb.org
License: Library GPL
Use: JacORB is used as the ORB for CORBA interaction between PlanetLabVisualizer and PlanetLabClient. It has replaced the Sun orbd because it provides CORBA over SSL. SSL is important to prevent hijacking of the code running on the PlanetLab nodes. The Client_Keystore (which is in the configs dir) and the Server_Keystore (found in deployDir/PlanetLabClient/configs) should be replaced with your own generated keys to provide security. The file keygeneration.txt (in the configs dir) explains how to do this. However, you'll only need these things if you intend to use the PlanetLabClient to start your experiments on PlanetLab nodes.
Documentation
If you intend to implement your own experiment logic, you'll need to extend the PlanetLabClient.
It is a much simpler piece of software than the PlanetLabVisualizer so it should be easier to understand too.
Most probably you'll need to extend the planetLabVideoClient.idl by inserting your new method prototype and then implementing it in the VideoClientImpl class.
Note that the PlanetLabClient API is still in development so it's subject to changes that may break your code extensions.
More detailed information is still to come..
Troubleshooting
(see First steps)
(see First steps)
			org.apache.xmlrpc.XmlRpcException: Failed to read servers response:
			sun.security.validator.ValidatorException: PKIX path building failed:

sun.security.provider.certpath.SunCertPathBuilderException: unable to find valid certification path to requested target
Solution: The certificate of the site www.planet-lab.org needs to be updated (it was changed or has expired):
Final comments
I hope this program can help you with your research using PlanetLab. Enjoy it ;-)
For support or if you have any comments, don't hesitate to contact me and give me feedback:
Leo Bosnjak ( ).
).
Hosted by
